

- A B2B software company randomizes organizations to receive a new tool, so everyone within an organization either has or doesn’t have access to it, but user-level productivity is the metric of interest.
- An education technology company randomizes teaching materials by school district for operational reasons, but measures student test score improvement.
- A marketplace randomizes by region to limit interference between buyers and sellers, but measures conversion per user.
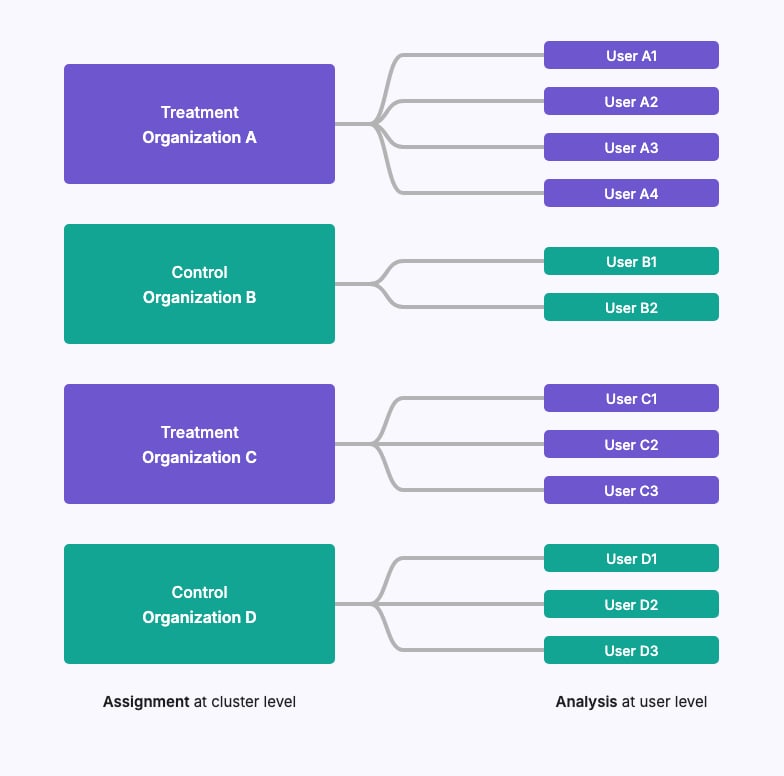
organization_id and analyze by user_id.
When to use it
Use a cluster experiment when:- Every subunit in a cluster must get the same variation (for example, a pricing or permissions change that has to be consistent across a company).
- Your metrics are defined per subunit (per user, per student) and you want results in those terms.
- You can run the experiment on enough clusters. GrowthBook warns when any variation has fewer than 20 clusters.
Prerequisites
- A Pro plan or higher.
- A SQL data source with experiment assignment queries.
-
An Identifier Type for the cluster (
organization_id) and one for the subunit (user_id). -
An Experiment Assignment Query that returns both columns, with each one mapped to its identifier type. For example:
-
Each
user_idbelongs to exactly oneorganization_id. -
Your SDK assigns variations by the cluster. If GrowthBook handles randomization, create an
organization_idattribute and use it as the experiment’s assignment attribute, so everyone in an organization gets the same variation.
How to set up a cluster experiment
- Open the experiment and go to the Setup tab.
- Under Analysis Plan, click the Data Source row to open the Data Source settings.
- Set Identifier Type to the cluster identifier (
organization_id), and pick an Experiment Assignment Table that also returns your subunit identifier. - Check Cluster experiment.
- Under Subunit identifier type, pick the subunit to analyze (
user_id). - Click Confirm.
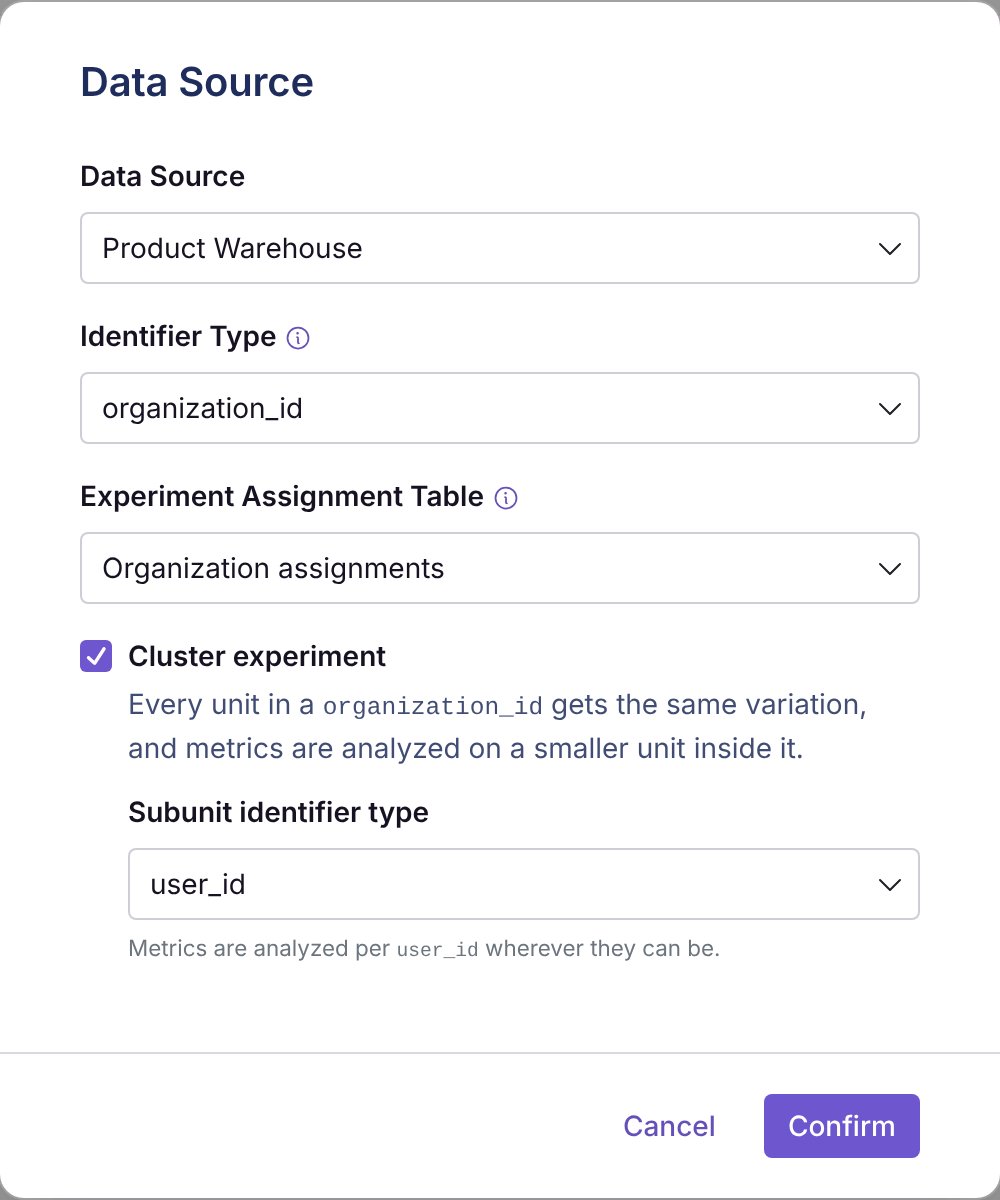
isClusterExperiment and clusterSubUnitIdentifier fields on experiments.
Choosing metrics
Cluster experiments support Fact Metrics of type proportion, retention, mean, and ratio. You don’t need to create separate cluster-level versions of your metrics. GrowthBook decides how to analyze each metric from the identifiers its fact table exposes:- Subunit metrics. If the fact table has the subunit identifier (directly or through an identifier join), the metric is analyzed per subunit, as described in Methodology. This needs the metric’s aggregations to be sum, count distinct, max, or hll merge.
- Cluster metrics. If the fact table has only the cluster identifier, the metric is analyzed with the cluster as the unit, like a standard experiment randomized on
organization_id.
Methodology
Rolling up subunits to clusters
For subunit metrics, GrowthBook:- Computes each subunit’s metric value, applying any capping at the subunit level.
- Aggregates subunit values to the cluster level, for both a numerator metric and a denominator metric.
- Using revenue as an example (i.e., a mean metric, and the approach is the same for proportion and retention metrics), sum subunit revenues to get the cluster-level total revenue (numerator metric). Cluster-level sample sizes are the denominator metric.
- If revenue-per-purchase is the metric (i.e., a ratio metric), we construct the numerator metric as above, but the cluster-level denominator metric is the cluster-level total number of purchases.
- Analyzes the cluster totals as a ratio metric, with the cluster as the unit of analysis.
What counts as a unit
Due to cluster-level randomization, unit counts and the Sample Ratio Mismatch check use the number of clusters in each variation. The Health tab’s traffic chart can switch between cluster and subunit counts. Unlike user-randomized designs, each dimension breakdown is computed in its own query. A single cluster’s subunits can land in several cells of a breakdown (for example, across browser × device type), and re-aggregating those cells doesn’t reproduce the correct cluster-robust variance — it can understate uncertainty.Data quality checks
Before analysis, GrowthBook removes data that would break the cluster design:- Mixed assignment. If a cluster’s subunits saw different variations, or any of its subunits saw more than one variation, the whole cluster is removed from results.
- Subunits in several clusters. If a subunit appears in more than one cluster, it is removed from results.
- A variation has fewer than 20 clusters. With this few, one unusual cluster can swing the result.
- A single cluster holds 20% or more of the subunits, so that one cluster can drive most of the result.
Limitations
- Supported metrics are fact metrics of type proportion, retention, mean, and ratio. Quantile, funnel, daily participation, and legacy (non-fact) metrics aren’t supported.
- Activation metrics aren’t supported.
- Post-stratification isn’t applied to cluster experiments. CUPED regression adjustment is.
- Scaled impact isn’t shown for subunit metrics.
- Bandits and holdouts can’t be cluster experiments.
- Cluster experiments need a SQL data source with experiment assignment queries.